Unraveling climate patterns and forecasting future
This project leverages advanced methods to analyze historical climate data and uncover hidden patterns, helping us understand and predict future climate conditions.
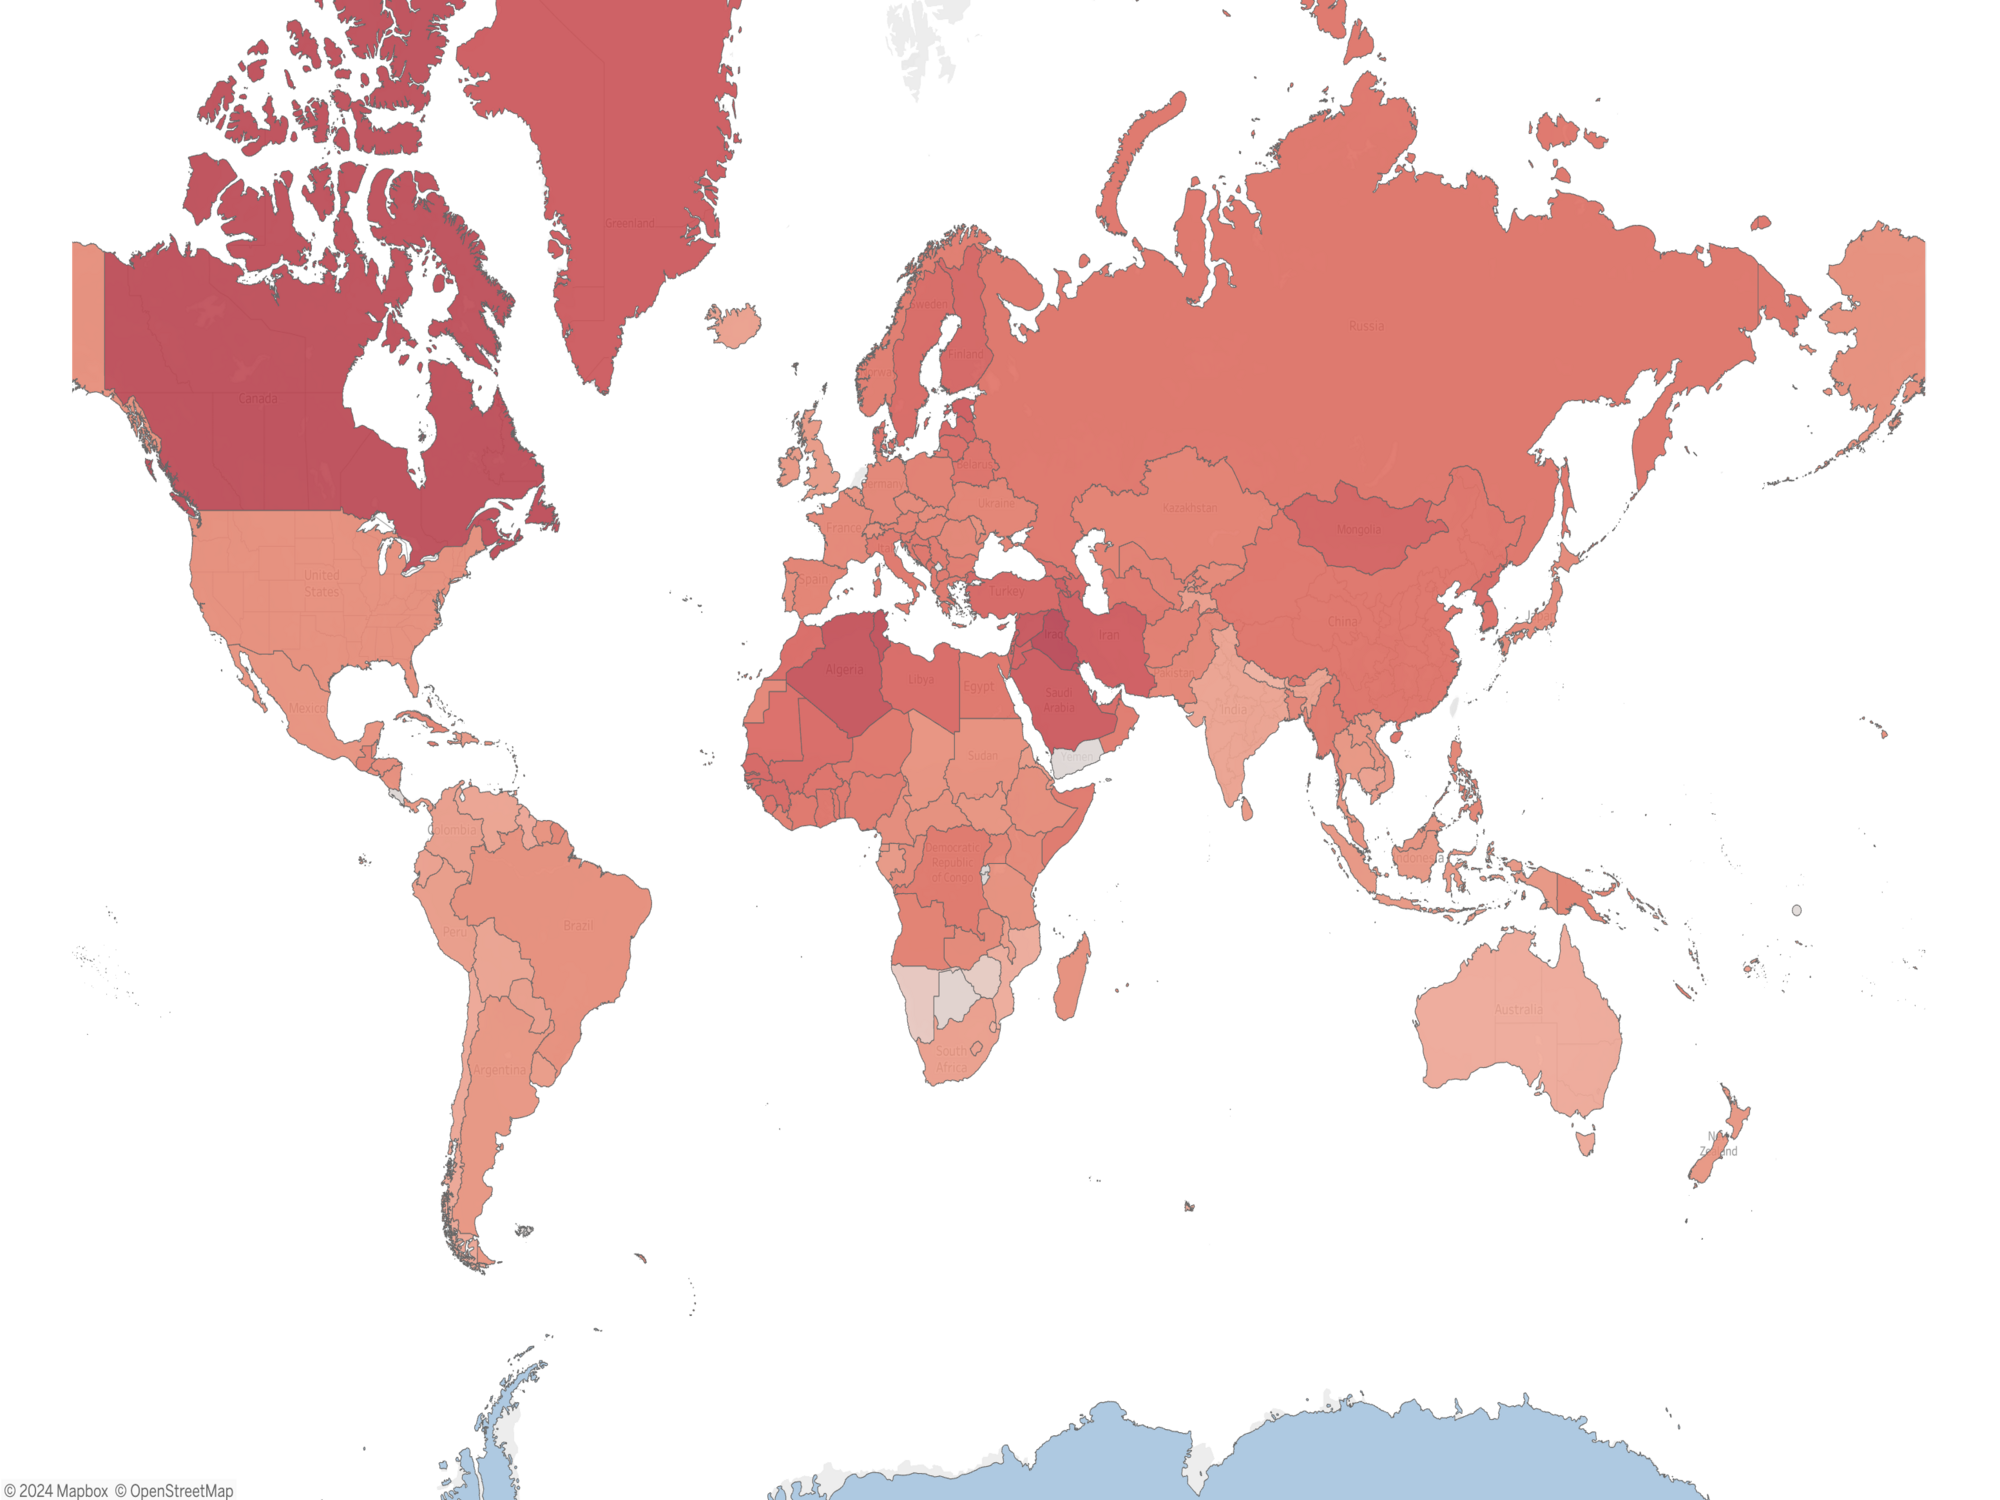
In this project, I created an interactive Smart Dashboard that combines climate data from the National Oceanic and Atmospheric Administration (NOAA) and employed ARIMA (AutoRegressive Integrated Moving Average) model to forecast weather. The dashboard delivers annual forecasts on a global scale, enabling users to explore climate patterns and trends across various regions. The project's main objective was to design a user-friendly platform that presents complex climate data in a simple and engaging format. The dashboard's adaptable design allows users to zoom into specific areas or view broad climate trends, providing a valuable tool for gaining insights into climate-related topics. By utilizing ARIMA models, I produced accurate forecasts for critical weather indicators, like Average Temperature. Our dashboard focuses on being clear and easy to use, allowing users to understand and engage with the data effortlessly. Through this effort, I aim to raise climate awareness to address shifting weather patterns.
Data Preprocessing and Analysis
To address the complex challenge of understanding climate patterns and predicting future weather conditions, our methodology centers on a comprehensive approach that blends advanced data analysis techniques and predictive modeling.
- We collected data from @NOAA – Climate data online
- Parameters collected : Average Temperature, Minimum & Maximum Temperature
- Over 224 countries with 600 climate stations data is collected.
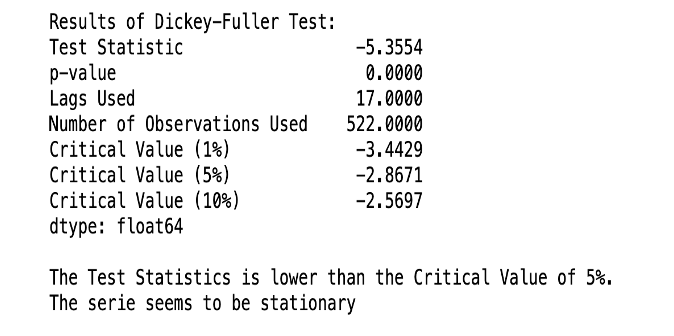
Stationarity Assessment: Augmented Dickey-Fuller (ADF) Test
- Null Hypothesis (H0): The time series dataset contains a unit root, suggesting non-stationarity.
- Alternative Hypothesis (H1): The time series dataset lacks a unit root, suggesting stationarity.
- If the p-value is lower than the critical value (0.05), we reject the Null Hypothesis; otherwise, we accept it. For our datasets, the majority have yielded results indicating rejection of the null hypothesis, implying that the datasets are stationary, as demonstrated below.
SARIMA model
SARIMA (Seasonal Autoregressive Integrated Moving Average) model is a powerful tool for time series forecasting, incorporating both trend and seasonal components. It builds upon ARIMA by considering seasonal variations, making it suitable for data with recurring patterns.
- It builds upon ARIMA by considering seasonal variations, making it suitable for data with recurring patterns.
- SARIMA parameters (p, d, q) are chosen based on autocorrelation and partial autocorrelation functions, while seasonal parameters (P, D, Q) are determined through seasonal differencing.
- ACF: Identifies correlation between time series & lagged values.
- PACF: Determines relationship between a point & its lag, excluding intervening lags.
- Interpretation: Significant spikes beyond confidence intervals indicate relationships.
- Parameters: Utilized (3,0,0) for order and (0,1,1,12) for seasonal order. Trend: Specified 'c' for constant trend component.
Model Validation
- Current vs Predicted Values
- Errors vs Predicted Values
- Residuals Normality Check
- Residuals Autocorrelation
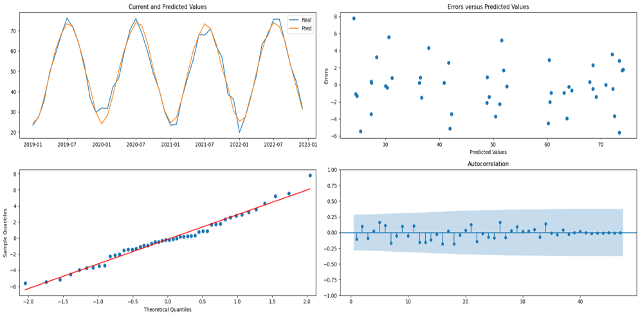
Observations
- Validation Results: SARIMA(3,0,0),(0,1,1,12),'c' model achieved an RMSE of 2.8908°C.
- Represents a significant improvement, reducing RMSE by -69.62% compared to baseline model.
- Unseen Data Baseline RMSE : 8.68°C
- Unseen Data SARIMA RMSE : 3.86°C. Demonstrates a notable enhancement, with an overall improvement of 55.59%.
Discover the full Python data analysis,preprocessing scripts and data on my GitHub! Dive into the details at @World-Climate-Data-Analysis .